My inference worker could compute a warm first token in about 20 milliseconds. Starting it from zero took a median 9.18 seconds.
That gap is why I started GPU Snapshot Lab: a public notebook for measuring GPU inference startup, keeping the raw results, and testing one hypothesis at a time.
The first experiment compares ordinary startup, CPU snapshot restore, and GPU snapshot restore. I collected 30 eligible cold samples for each path, then ran a smaller compatibility test with torch.compile.
The eager result is reasonably clear: snapshots lowered median caller time to first token in this cohort. The more interesting learning is about what work the snapshot preserves. In the compiled smoke test, moving the capture boundary past the first forward moved roughly 39 seconds of initialization out of the restore path.
There are also results I cannot explain yet: a verified GPU restore took 60.06 seconds, and much of caller latency sits outside my application timers. Those observations belong in the experiment too.
What I actually measured
The workload is deliberately small: Qwen2.5-0.5B-Instruct, FP16, one fixed prompt, one greedy token, eager attention, and no KV cache. The model revision is pinned. This is a direct Transformers forward pass, not a production serving engine or a throughput benchmark.
I used Modal as the execution backend, requesting the A10 GPU class, two CPU cores, and 8 GiB of host memory. The model files are baked into the image; downloading weights from Hugging Face is outside the measured interval. The runtime uses PyTorch 2.6.0, Transformers 4.51.3, and CUDA 12.4.
The prompt is:
Explain why the sky is blue in one sentence.
Each invocation returns exactly one selected token. Every successful measured invocation returned token ID 576, decoded as " The". That is a useful consistency check for this input; it is not a validation of complete generated answers or numerical equivalence across the whole model.
There are two clocks:
- Caller TTFT: from beginning the remote invocation until the caller receives the token event. This includes startup, scheduling, RPC, and delivery effects.
- Worker TTFT: time inside the method, covering tokenization, input transfer, forward computation, token selection, and decoding.
An immediate second request to the same worker measures warm behavior. Cold and warm measurements stay separate.
Three paths through initialization
An ordinary worker imports libraries, loads its tokenizer and CPU weights, initializes CUDA, transfers weights, and executes two warmup forwards before serving.
A CPU snapshot preserves the imports, tokenizer, and CPU model. CUDA initialization, GPU transfer, and warmup happen after restoration. A GPU snapshot also preserves the GPU initialization and warmed model state. These are the capture boundaries used in this experiment; other applications can choose different boundaries. Modal exposes that placement through its snapshot lifecycle hooks.
At the time of this experiment, Modal labels GPU Memory Snapshots as an alpha feature. Its documentation also warns that they do not accelerate storage-bound model loading and can interact poorly with torch.compile. I treat the results below as measurements of this specific setup, not as a general production guarantee.
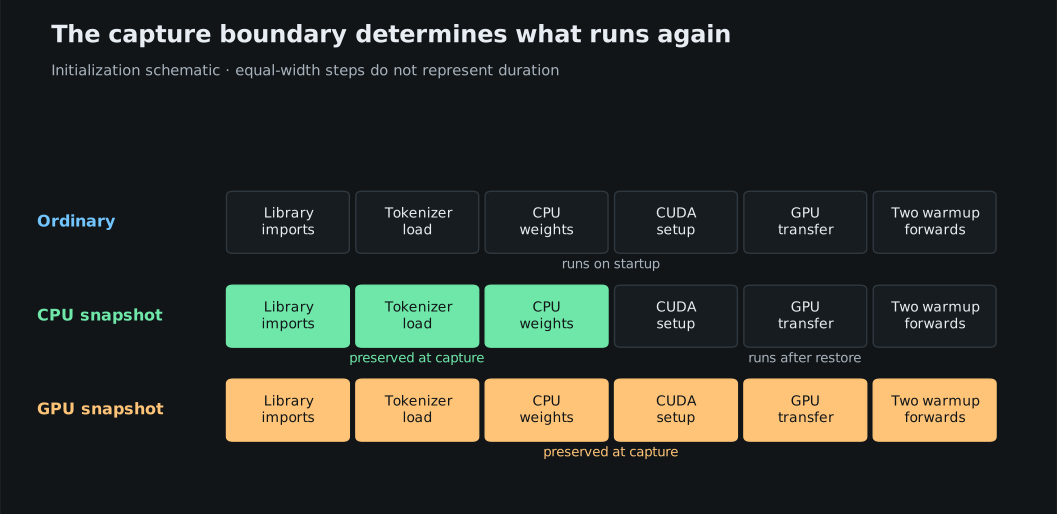
The boundary decides which initialization work runs again. Box widths do not represent time. Snapshot creation happens before subsequent restore requests.
Two warmup forwards are intentional. The first can pay initialization costs that the second does not. In the compiled variant, I separately time torch.compile wrapper construction, the first forward, and the second forward. Timing only the wrapper would miss most of the work observed here.
Before comparing numbers, prove the worker is cold
Setting the minimum container count to zero is not sufficient evidence. A previous worker can still be alive, and enabling snapshots does not mean every invocation restores one. Some invocations create snapshots.
The collector waits until the platform reports zero runners and zero running inputs before starting the caller timer. That waiting period is outside TTFT. Then it checks a fresh worker identity and a first-request index. The identity is generated after restore: an identifier stored in a snapshot would be shared by every worker restored from it.
For snapshot samples, I also match the worker identity to platform logs and require evidence of restoration from a separately observed capture lineage. Creation-inclusive requests and requests with insufficient proof do not enter the restore cohort.
The eager collection made 95 attempts:
| Path | Attempts | Eligible cold samples | Exclusions |
|---|---|---|---|
| Ordinary | 30 | 30 | None |
| CPU snapshot | 33 | 30 | 2 creation runs; 1 without sufficient restore proof |
| GPU snapshot | 32 | 30 | 2 creation runs |
There were zero errors, zero output mismatches, and zero warm-worker reuses in this repeated eager collection. An offline check with the stricter capture-lineage rule changed zero classifications. Both the original and reviewed evidence are retained.
This definition of cold means a fresh application worker. I do not control whether its physical host, image cache, or filesystem cache is cold.
The eager results: a lower median, with a long tail
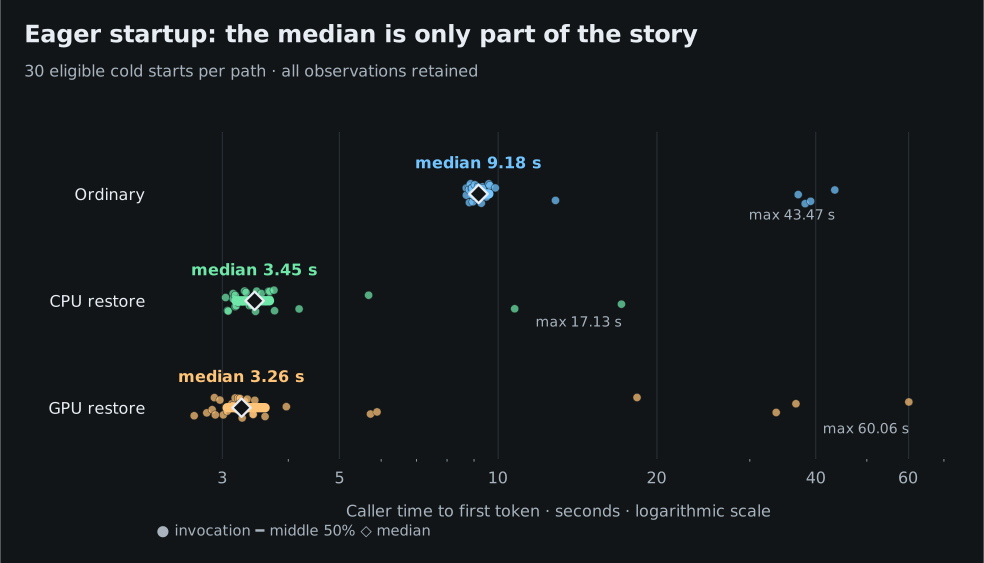
Each dot is an eligible invocation. The thick interval is the middle 50% of observations; the diamond marks the median. The horizontal axis is logarithmic. Every outlier remains visible.
| Eager path | Median caller TTFT | Middle 50% | Observed range |
|---|---|---|---|
| Ordinary | 9.18 s | 8.94–9.60 s | 8.70–43.47 s |
| CPU restore | 3.45 s | 3.19–3.69 s | 3.04–17.13 s |
| GPU restore | 3.26 s | 3.06–3.61 s | 2.65–60.06 s |
The CPU snapshot captures enough work to move the median substantially below ordinary startup. The GPU snapshot has a median only 191.13 ms lower than the CPU snapshot in this cohort. For this small eager model, preserving GPU initialization is a much smaller incremental change than preserving imports and CPU model construction.
But the GPU restore’s maximum is 60.06 s. I have no evidence that isolates its cause. It stays in the dataset and the chart. A lower median does not establish a reliable latency bound.
The same-worker warm computation medians are 20.04 ms ordinary, 20.19 ms CPU restore, and 20.14 ms GPU restore, with 30 probes per path. The seconds of caller startup are therefore a different problem from the roughly 20 ms warm forward.
I report medians, interquartile ranges, and observed extrema. At 30 samples per path, I omit p95 rather than present a thin tail estimate as a stable property of the system.
Where did the time go?
The largest instrumented ordinary-startup stage is library imports, with a median 2,780.37 ms. CPU weight loading follows at 1,949.24 ms. GPU transfer is 120.98 ms, and CUDA initialization is 196.97 ms.
That already changes my priorities: CUDA setup is not the largest application stage in this workload.
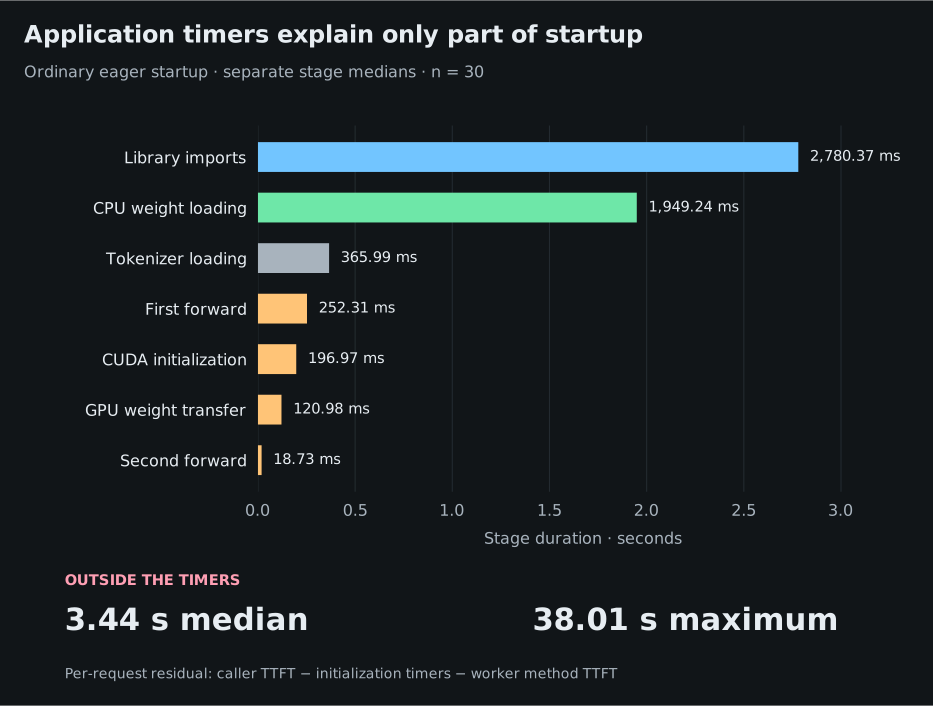
Stage bars are separate marginal medians across 30 ordinary starts; adding them does not reconstruct the median invocation. The residual is calculated per request before its distribution is summarized.
For each invocation, I calculate:
outside instrumented stages
    = caller TTFT
    - current-worker initialization timers
    - worker method TTFT
For snapshot restores, “current-worker initialization” includes only work performed after restore. Captured initialization timings describe the snapshot’s creation; subtracting those from every restored request would count work that did not run again.
The ordinary-startup residual has a median 3,441.58 ms and a maximum 38,008.39 ms. It includes untimed initialization and metadata collection, platform scheduling, RPC, and token delivery. In a restore path it can also include restoration work that my application timers cannot observe. It is an accounting remainder, not a measurement of “container boot” or “network latency.”
One ordinary invocation took 38,195.15 ms, while its instrumented initialization stages totaled 5,749.63 ms. The instrumentation explains part of the request, not every millisecond. My next instrumentation improvement needs to target that gap.
GPU work is synchronized around the GPU stage timers so the measurement waits for completion. CUDA initialization itself is handled separately: synchronizing before its timer would initialize CUDA before the stage begins. PyTorch documents what torch.cuda.synchronize waits for.
Compilation changes the value of the boundary
The next hypothesis was that a GPU snapshot becomes more valuable when warmup produces expensive compiled runtime state.
I kept the model, prompt, precision, eager attention, and two forwards the same, and wrapped the model with:
torch.compile(model, mode="default", dynamic=False)
With dynamic=False, PyTorch specializes the compiled kernels to the observed input shapes rather than trying to produce dynamic kernels. That fits this fixed-shape smoke test, but it is another reason not to extrapolate the result to variable-length serving traffic.
Compiler threads are limited to one in all configurations. The experiment does not explicitly capture CUDA graphs. CPU snapshot mode performs GPU setup and compilation after restore; GPU snapshot mode performs them before capture.
This is a smoke test, with one eligible sample per path, not a repeated compiled benchmark. There were five attempts: one ordinary start, two CPU attempts, and two GPU attempts. The CPU and GPU creation attempts are excluded from the restore comparison. All five returned the expected token, with zero errors.
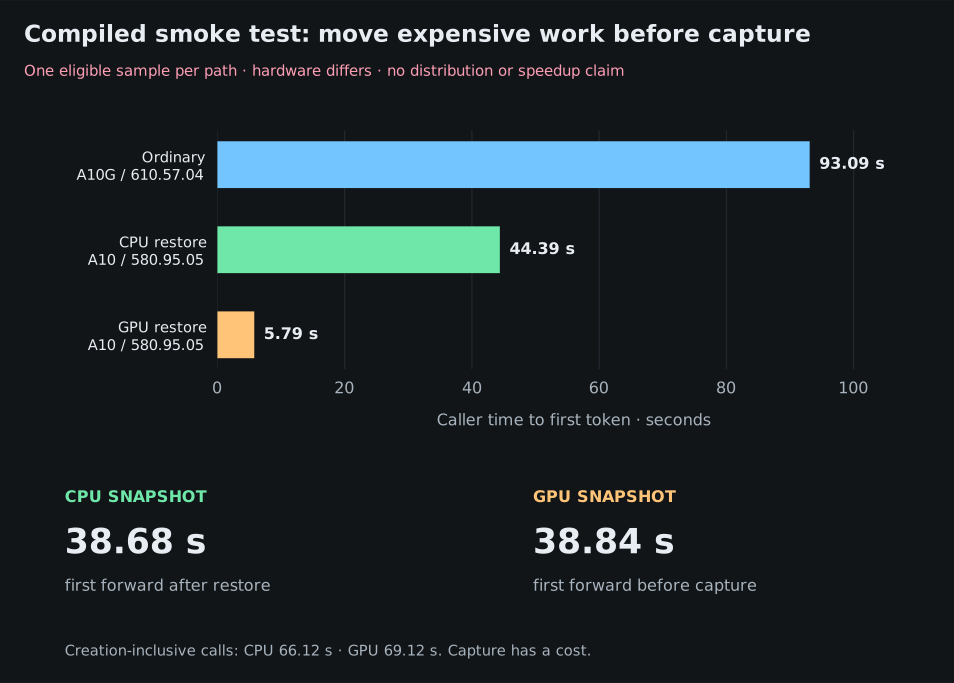
One observation per path. The ordinary sample uses a different GPU/driver pair. These bars validate a mechanism; they do not establish a fair speedup estimate.
The CPU restore spends 38,678.90 ms in its first forward after restore. The GPU snapshot’s creation spends 38,840.37 ms in that forward before capture. The subsequent GPU restore returns the expected token in 5,789.58 ms without repeating that initialization hook.
The expensive work has moved across the capture boundary. It has not disappeared: the creation-inclusive CPU request takes 66.12 s, and the GPU request takes 69.12 s. If a deployment keeps creating snapshots, or changes frequently enough that capture costs matter, those costs belong in the operational evaluation.
The first worker request after GPU restore still takes 139.70 ms, versus 8.48 ms on its immediate warm probe. Preserving initialization does not eliminate all first-request work. I have not isolated the source of that remaining difference.
The controls exposed another variable
Requesting the A10 class did not give every invocation the same physical GPU and driver.
The eligible eager ordinary and CPU-restore cohorts use NVIDIA A10 / driver 580.95.05. GPU restore has 29 samples on that pair and one on NVIDIA A10G / driver 610.57.04. The A10-only GPU median is 3,254.04 ms; the single A10G observation is 3,966.64 ms.
In the compiled smoke test, the ordinary start lands on A10G, while both restores land on A10. Its first forward takes 76.44 s, compared with roughly 39 s for the other initialization paths. I cannot assign that difference to hardware, driver, host load, or cache state from these observations.
Configuration order is randomized within each serial collection round, but eager and compiled measurements happen in separate phases. That adds time and placement confounds. I report the environment groups separately in the raw analysis and do not claim a causal compilation speedup from this smoke test.
A failure that improved the harness
Before collecting the repeated cohort, an initial smoke invocation delivered its token at 12,226.66 ms, then failed while decoding the metadata payload on the caller. Sending torch.__version__ directly had carried a Torch-specific version object across the boundary. Converting it to a plain string fixed that serialization issue, and a regression check covers it.
That failed request is preserved in the initial smoke entry. It did not enter the later 90-sample cohort. Receiving the token was not enough: the experiment also needed the metadata required to validate the worker and interpret its timings.
What I learned, and the next experiment
The eager measurements tell me that preserving imports and CPU model construction is already useful for this workload. Capturing GPU warmup adds a modest median improvement here, while a long restore outlier remains unexplained.
The compiled smoke test points to a stronger reason to capture GPU state: preserve the result of expensive initialization. The key question is how much repeatable work lies before the capture boundary, and how much startup remains after restoration.
Next I want 30 verified compiled starts per path, with GPU/driver groups reported separately, before trusting the compiled distributions. I also want to explain more of the caller residual and test whether the first-request gap persists after restore. Larger models and serving-engine KV caches are separate experiments; this one does not measure them.
The repository contains the collector, pinned model revision, source archives, raw requests, platform logs, eligibility mappings, and summaries. The experiment entry records the hypothesis, method, numbers, conclusion, and next question. Every exclusion and outlier is available for review.